
Continuing from the previous article.

(Source: https://www.franklincovey.com/the-4-disciplines/)
We established the WIG and the Act on lead measure. We tried to establish a metric, Energy Consumption Quotient (ECQ) which can help in taking informed and calculated steps towards the WIG.
Let us try to explore the ECQ further and see if we can make a “Compelling Scoreboard”.
ECQ is defined as the ratio of the amount of renewable energy produced and non-renewable energy conserved to the total amount of energy consumed in a process.
Energy Consumption Quotient (ECQ) = (Energy Produced + Energy Conserved)/ Total Energy Consumed
Energy Produced: The amount of energy produced for a process without consuming from a supply chain and produced from a renewable source
Energy Conserved: The amount of energy saved by avoiding certain activity
Total Energy Consumed: The total amount of energy consumed in a process
In order to have a process to be energy-ecologically efficient, or have a lesser ecological footprint, ECQ needs to be close to 1.0.
The ECQ can help in various aspects in defining a metric which can be easily calculated and understood. Comparing ECQ and Carbon Footprint
| Energy Consumption Quotient | Carbon Footprint |
| Less assumptions in calculations | More assumptions in calculations |
| Easy to calculate | Difficult to calculate |
| Shows indirect impact on environment | Shows direct impact on environment |
| Not an established concept | Well established concept |
Carbon footprint provides a metric that shows the direct impact on the environment in terms of tons of CO2. However, this effect is not easily deducible and can be misleading as we had seen earlier (https://amenergy.solutions/2021/10/02/are-we-following-the-right-footprints/).
Scenario 1:
Let us try to compare a situation for an enterprise and see the metric of carbon footprint vs ECQ.
An organization has 200 employees, each equipped with individual laptops, cell phones. The building has sitting places, meeting rooms, garages, store rooms, break rooms, server rooms etc. To understand the carbon footprint/ ECQ of the organization, the company CEO hires a consultant.
The consultant observes the working pattern of the company silently and only asks questions if necessary. The consultant also sends out a few surveys and forms to be filled out by the employees. After a 2 month long research and analysis the consultant provides the results in this format:
- Carbon Footprint per person, Avg: 58MT CO2eq/ per year
- Carbon Footprint per person, Max: 200MT CO2eq/ per year
- Carbon Footprint per person, Min: 20MT CO2eq/ per year
- Overall Carbon Footprint for the company, Avg: 20,000MT CO2eq/ per year
It is worth noting that the carbon footprint calculated by the consultant is highly approximated. For instance, in order to calculate the footprint per person, the consultant follows the following approach
- Assume an 8 hour every day office (5 days a week)
- Consistent use of laptop throughout the day on charging
- Consistent use of electricity by using the lights, air-conditioning, coffee machine, microwave etc.
- Drive from and to home everyday using gasoline powered vehicles. Considering 16 miles travel everyday on an average.
- Printing on an average 10 papers every month
The total kWH consumed by the company can be easily calculated however the average CO2 emission per kWH consumption at an industrial place requires a significant approximation based on the power plant source. The average distance covered by an employee everyday for commuting can be easily found out, however the CO2 emissions from his/ her car can significantly change. The EPA website uses a standard set in 2010. There have been significant improvements in combustion science since then and also in electric cars.
To reduce the footprint, the consultant also provides solutions, such as
- Provide common printer for people
- Increase paperless work
- Have motion sensing lights in the room
- Use LED lighting
- Reduce the server load by having documents on cloud storage
- Use laptops and not desktops
- Use personal coffee mugs
- Use rechargeable batteries as much as possible.
- Avoid unnecessary in-person meetings and encourage virtual environment
- Encourage carpooling or work from home
- Use water filters instead of bottled water.
- Use solar panels on the building rooftop.
It is safe to assume that in today’s world almost every company has already implemented/ encouraged points 1-10. Point 11 is a good one but has many variables associated with it but definitely contributes towards less use of plastic bottles. The last option is something that is not always possible for every company but definitely affects the climate impact.
The consultant also suggests that with application of the above 12 points the company can expect to reduce their carbon emissions by almost 50%.
However impressive the research and the findings and impact may be, there is a huge drawback with this plan. The effect is not seen by the employees and neither is there a dashboard on which they can see their progress. It is like walking in a forest. Continuing to walk will eventually get you out of the forest but if you do not know whether you have made progress, you may be just circling in a loop and may not be able to get out in time.
It is essential to have a scoreboard or a place where a person participating in such activities understands their position. It is also essential that the user understands how the scoreboard was prepared and what goes in the calculation of the particular metric.
Let us try to look at the same situation with respect to ECQ.
An organization has 200 employees, each equipped with individual laptops, cell phones. The building has sitting places, meeting rooms, garages, store rooms, break rooms, server rooms etc. To understand the carbon footprint/ ECQ of the organization, the company CEO hires a consultant.
The consultant observes the working pattern of the company silently and only asks questions if necessary. The consultant also sends out a few surveys and forms to be filled out by the employees. After a 2 month long research and analysis the consultant provides the results in this format:
- ECQ of the company, Avg: 0.3
- ECQ per person, Avg: 0.1
- ECQ per person, Min: 0.0
- ECQ per person, Max: 0.5
To increase the ECQ, the consultant provides solutions as mentioned previously. Since the energy supplied to the office building is from a nuclear power plant, it is not possible to achieve ECQ 1.0, unless the company adopts a solar panel or self owned wind power.
Let us assume that the office does install solar panels which is able to lower the overall energy consumption by 35%. This will bring the overall ECQ for the company to 0.65.
ECQ for each person goes up as well as they now consume less energy from the nuclear energy supply. Installation of less printers, adopting cloud solutions for data storage, using motion sensing lights can help in reducing the energy consumption and it is easy to calculate the difference between the kWH consumed earlier vs now.
ECQ allows us to have a metric which can be easily tracked by every individual and the entire organization. The WIG requires a dashboard which can be easily tracked and understood. As compared to Carbon Footprint, the ECQ is not just easy to track but also easy to calculate.
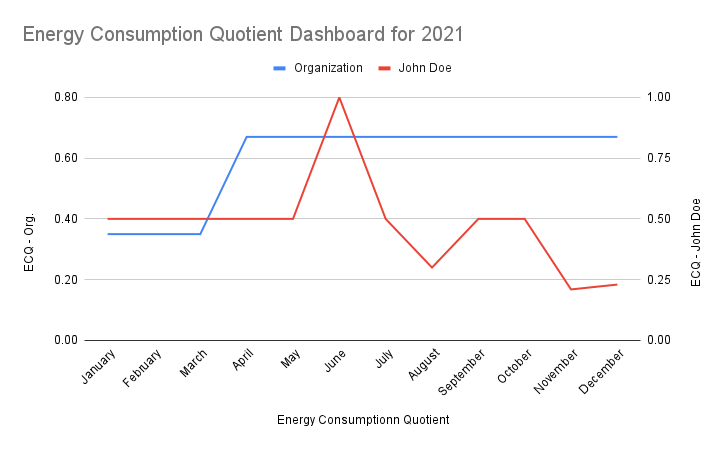
A typical Carbon Footprint vs ECQ chart is shown below. The solar panels were installed in the office building in March 2021, hence the carbon footprint reduced from April and the ECQ also increased. However, the ECQ per person was affected much as people were working from home. There were few trips made to the office in August, November and December which reduced the ECQ. The carbon footprint can be seen to be increasing and decreasing based on the climate (hot or cold weather) however the ECQ remains steady as it represents the proportion of the energy conserved vs consumed. In June, John took a vacation which reduced his Carbon Footprint to 0 and ECQ to 1.0.

Scenario 2:
Let us take another example of John Doe being in the home. The user tries to identify the carbon footprint for his home and uses the epa.gov or carbonfootprint.com websites to help him. John decides to purchase solar panels for his roof and an electric car.
John’s estimated carbon footprint is approximately 850MT of CO2 per year. This is spread across each month almost equally. During the extreme cold or hot days the carbon footprint will increase due to higher consumption of electricity or gas. Switching to solar panels and electric cars reduces the footprint but it is hard to analyze the overall impact. It is not possible to calculate the exact greenhouse impact of creating those solar panels or electric cars.
ECQ of John would remain consistent unless John changes something in the household which impacts the usage of any energy feature.For instance, if John installs motion sensing lights in the house, it would save on an average 50kWH every month. This increased the ECQ of his household but very slightly. With installation of solar panels, John is now completely self dependent on his energy needs for a quarter of his needs. That brings ECQ to 0.25.
From the chart we can see that there is a reduction in carbon footprint and increase in ECQ as John purchases solar panels and the electric car. Interestingly the increase in ECQ is not due to purchase of the electric car but implementation of solar panels. If John uses all the energy from the solar panel to charge the electric car, the ECQ will rise further as his transportation ECQ becomes absolute 1.0.
In order to calculate the effect on ECQ, John only needs to identify what was the reduction in the kWH consumption for any change he brings to his house. However, in order to calculate carbon a lot of assumptions take place as it may be an indirect effect.


I have tried to explain the concept of ECQ (Energy Consumption Quotient) in 2 scenarios and tried to put it against the 4DX principles to have a compelling scoreboard.
I will continue with this discussion and will try to explore the implementation of carbon footprint and ECQ on cascading/ domino effect.
References:

I enjoyed reading this article, it is very well written.
LikeLike
Thank you sir
LikeLike